OpenCanary, One versus One
The joy of being a low-cost security researcher saw my Splunk Enterprise licence revert to a free one and the login that I used die. Taking the dashboards with it!!
Thankfully, the index was complete and still being fed – so it was just a case of rebuilding the dashboards to display useful, interesting and meaningful data.
The two OpenCanary installations are feeding the Splunk and dashboards exist to display the collective findings of that data. However, the Race to the Bottom is most interesting and brings some great statistics.
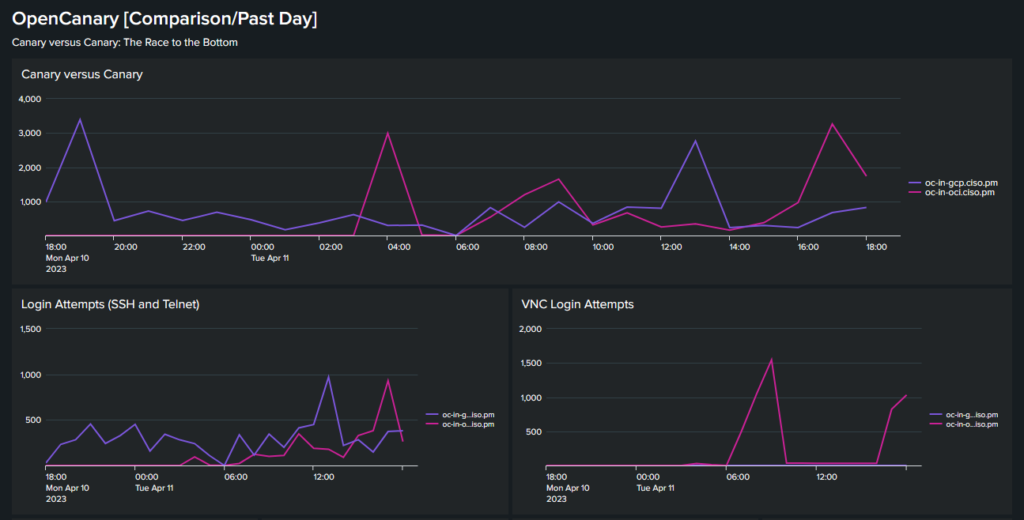
The first part of the dashboard is the connection requests, pitching the Oracle-hosted OpenCanary against the Google-hosted OpenCanary. They appear to take turns in being attacked.
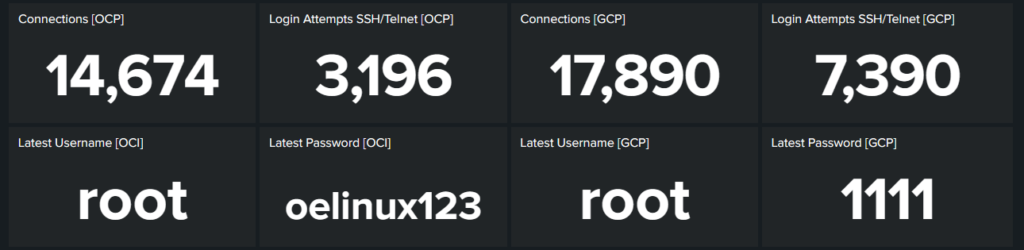
The raw data on the connections and login attempts comes next, with a summary of the latest username and password being attempted for each OpenCanary instance.
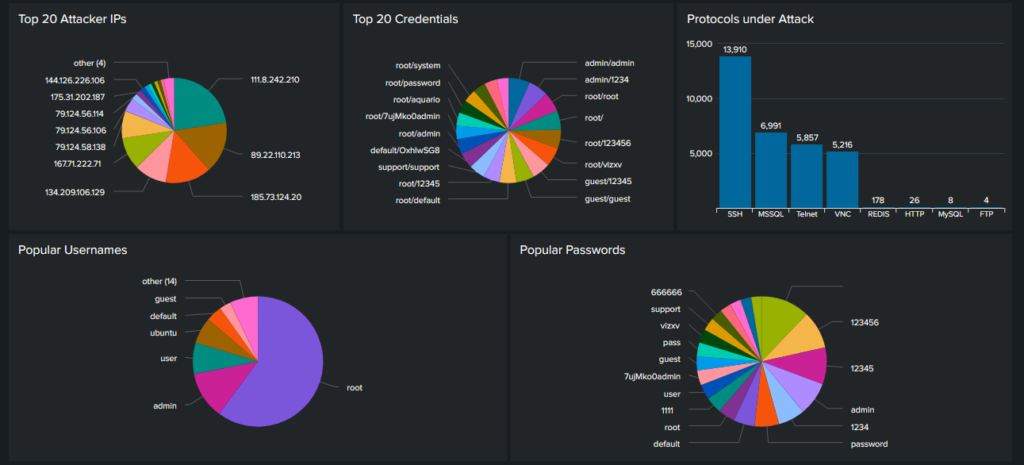
Piecharts! At times, certain IP addresses really hit the OpenCanary instances. Credentials are largely the same – the so-called Mirai List (or, rather, the passwords that have never been changed from their defaults) feature heavily.
There is scope for the dashboard to update and be modified; protocol popularity per OpenCanary might be something that gives an interesting breakdown of which OpenCanary is being targetted on which ports.
OpenCanary is popular! Or at least my two birds are…