
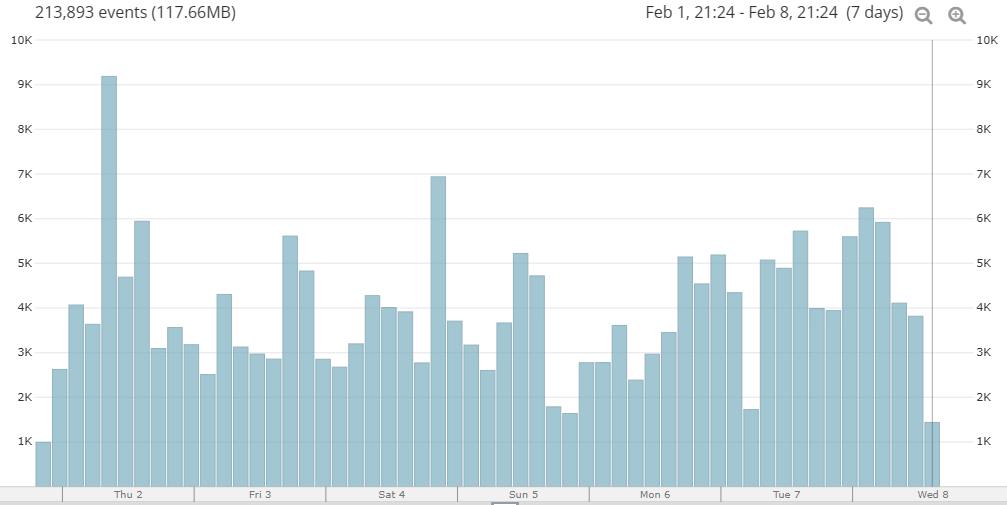
The Loggly solution I’ve been using is basic and limited, basically being able to give an overview of the previous 7 days of events. It presently shows 213’000 events with a drill-down to 110’000 login attempts.
The Basics
The Webhook approach that OpenCanary offers, pushing a JSON event to the destination, appealed to me and I embarked on implementing a Splunk Free instance to fulfil my needs. The main limit in volume of data was under the forecast I had according to Loggly (roughly 100-120Mb per week).
And so I installed a Ubuntu 22.04 server on a VM in my DMZ and laid Splunk onto it. The index for the OpenCanary to deposit into was created and the Webhooks Input app added to the installation.
The Webhooks Input allows the simple configuration of a port, a path and the destination index and then it’s ready for input.
Interconnectivity
Being security conscious, I wanted to avoid having my Webhook interface open to the Internet. I decided, since my two hosts are running Tailscale, the Webhook is being delivered via the Tailscale layer. Marvellous! It’s not HTTPS but the packets are small, private and integrity is 99.9% certain.
JSON: The Challenge
Due to the fact the JSON messages come into Splunk with the fields in different orders, there was a challenge with the field extractor in Splunk; it failed on too many log lines which was suboptimal.
message="{\\"dst_host\\": \\"10.0.0.117\\", \\"dst_port\\": 23, \\"local_time\\": \\"2023-02-08 16:20:12.113362\\", \\"local_time_adjusted\\": \\"2023-02-08 17:20:12.113390\\", \\"logdata\\": {\\"PASSWORD\\": \\"admin\\", \\"USERNAME\\": \\"Administrator\\"}, \\"logtype\\": 6001, \\"node_id\\": \\"hostname.domain\\", \\"src_host\\": \\"114.216.162.49\\", \\"src_port\\": 47106, \\"utc_time\\": \\"2023-02-08 16:20:12.113383\\"}" path=/opencanary/APIKEY_SECRET full_path=/opencanary/APIKEY_SECRET query="" command=POST client_address=100.86.224.114 client_port=54770

message="{\\"dst_host\\": \\"10.0.0.117\\", \\"dst_port\\": 22, \\"local_time\\": \\"2023-02-08 16:20:11.922514\\", \\"local_time_adjusted\\": \\"2023-02-08 17:20:11.922544\\", \\"logdata\\": {\\"LOCALVERSION\\": \\"SSH-2.0-OpenSSH_5.1p1 Debian-4\\", \\"PASSWORD\\": \\"abc123!\\", \\"REMOTEVERSION\\": \\"SSH-2.0-PUTTY\\", \\"USERNAME\\": \\"root\\"}, \\"logtype\\": 4002, \\"node_id\\": \\"hostname.domain\\", \\"src_host\\": \\"61.177.172.124\\", \\"src_port\\": 17802, \\"utc_time\\": \\"2023-02-08 16:20:11.922536\\"}" path=/opencanary/APIKEY_SECRET full_path=/opencanary/APIKEY_SECRET query="" command=POST client_address=100.86.224.114 client_port=54768
The solution is to basically break down the JSON into tagged columns, breaking out the fields from the labels. It took some time – and a cry for help – to steer me away from Regex and to this solution.
index="myindex"
| rex "message=\"(?<message>{.+})\" +path="
| eval message = replace(message, ".\"", "\"")
| spath input=message
The data was now successfully in Splunk and the Dataset was clean. Next step, Pivots and Dashboards!
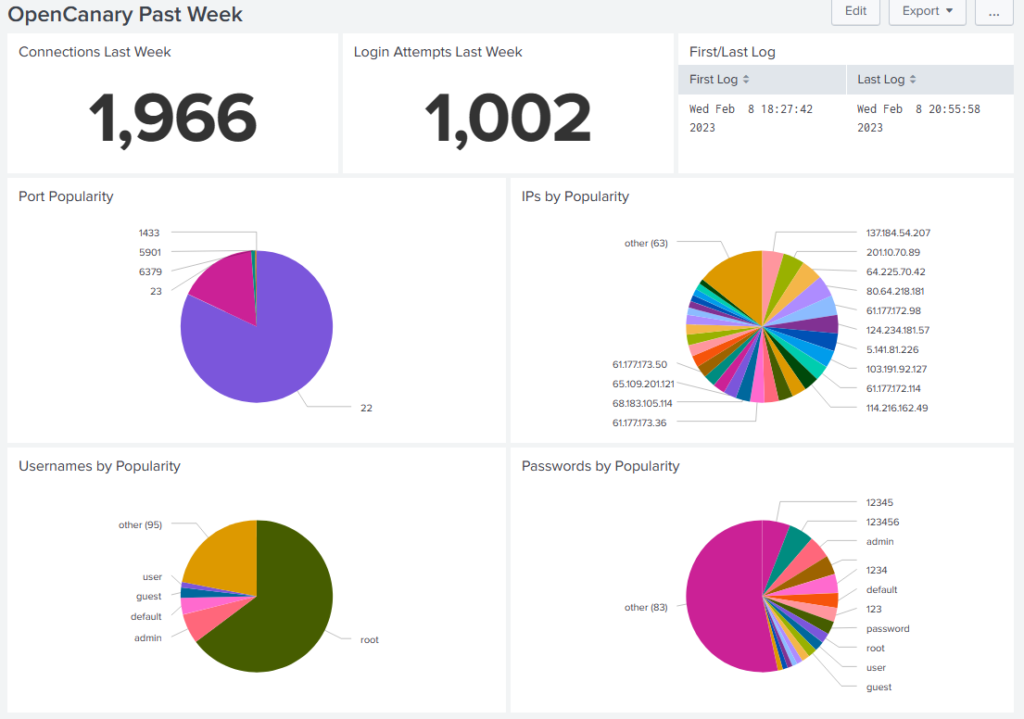
Getting Meaningful Output
I fixed on setting up parallel dashboards with statistics on connections, login attempts with port, IP, username and password information being available too. Splunk allows the dashboard panels to autorefresh and on the weekly statistics dashboards, the values refresh every 30 seconds.
It seems really stable, quick and useful. The host is being monitored with New Relic and the CPU load is flat under 20%; it seems my virtual host is up to the task, as is my 10Gbps Internet connection!